01 / 06
Global Climate Projection App
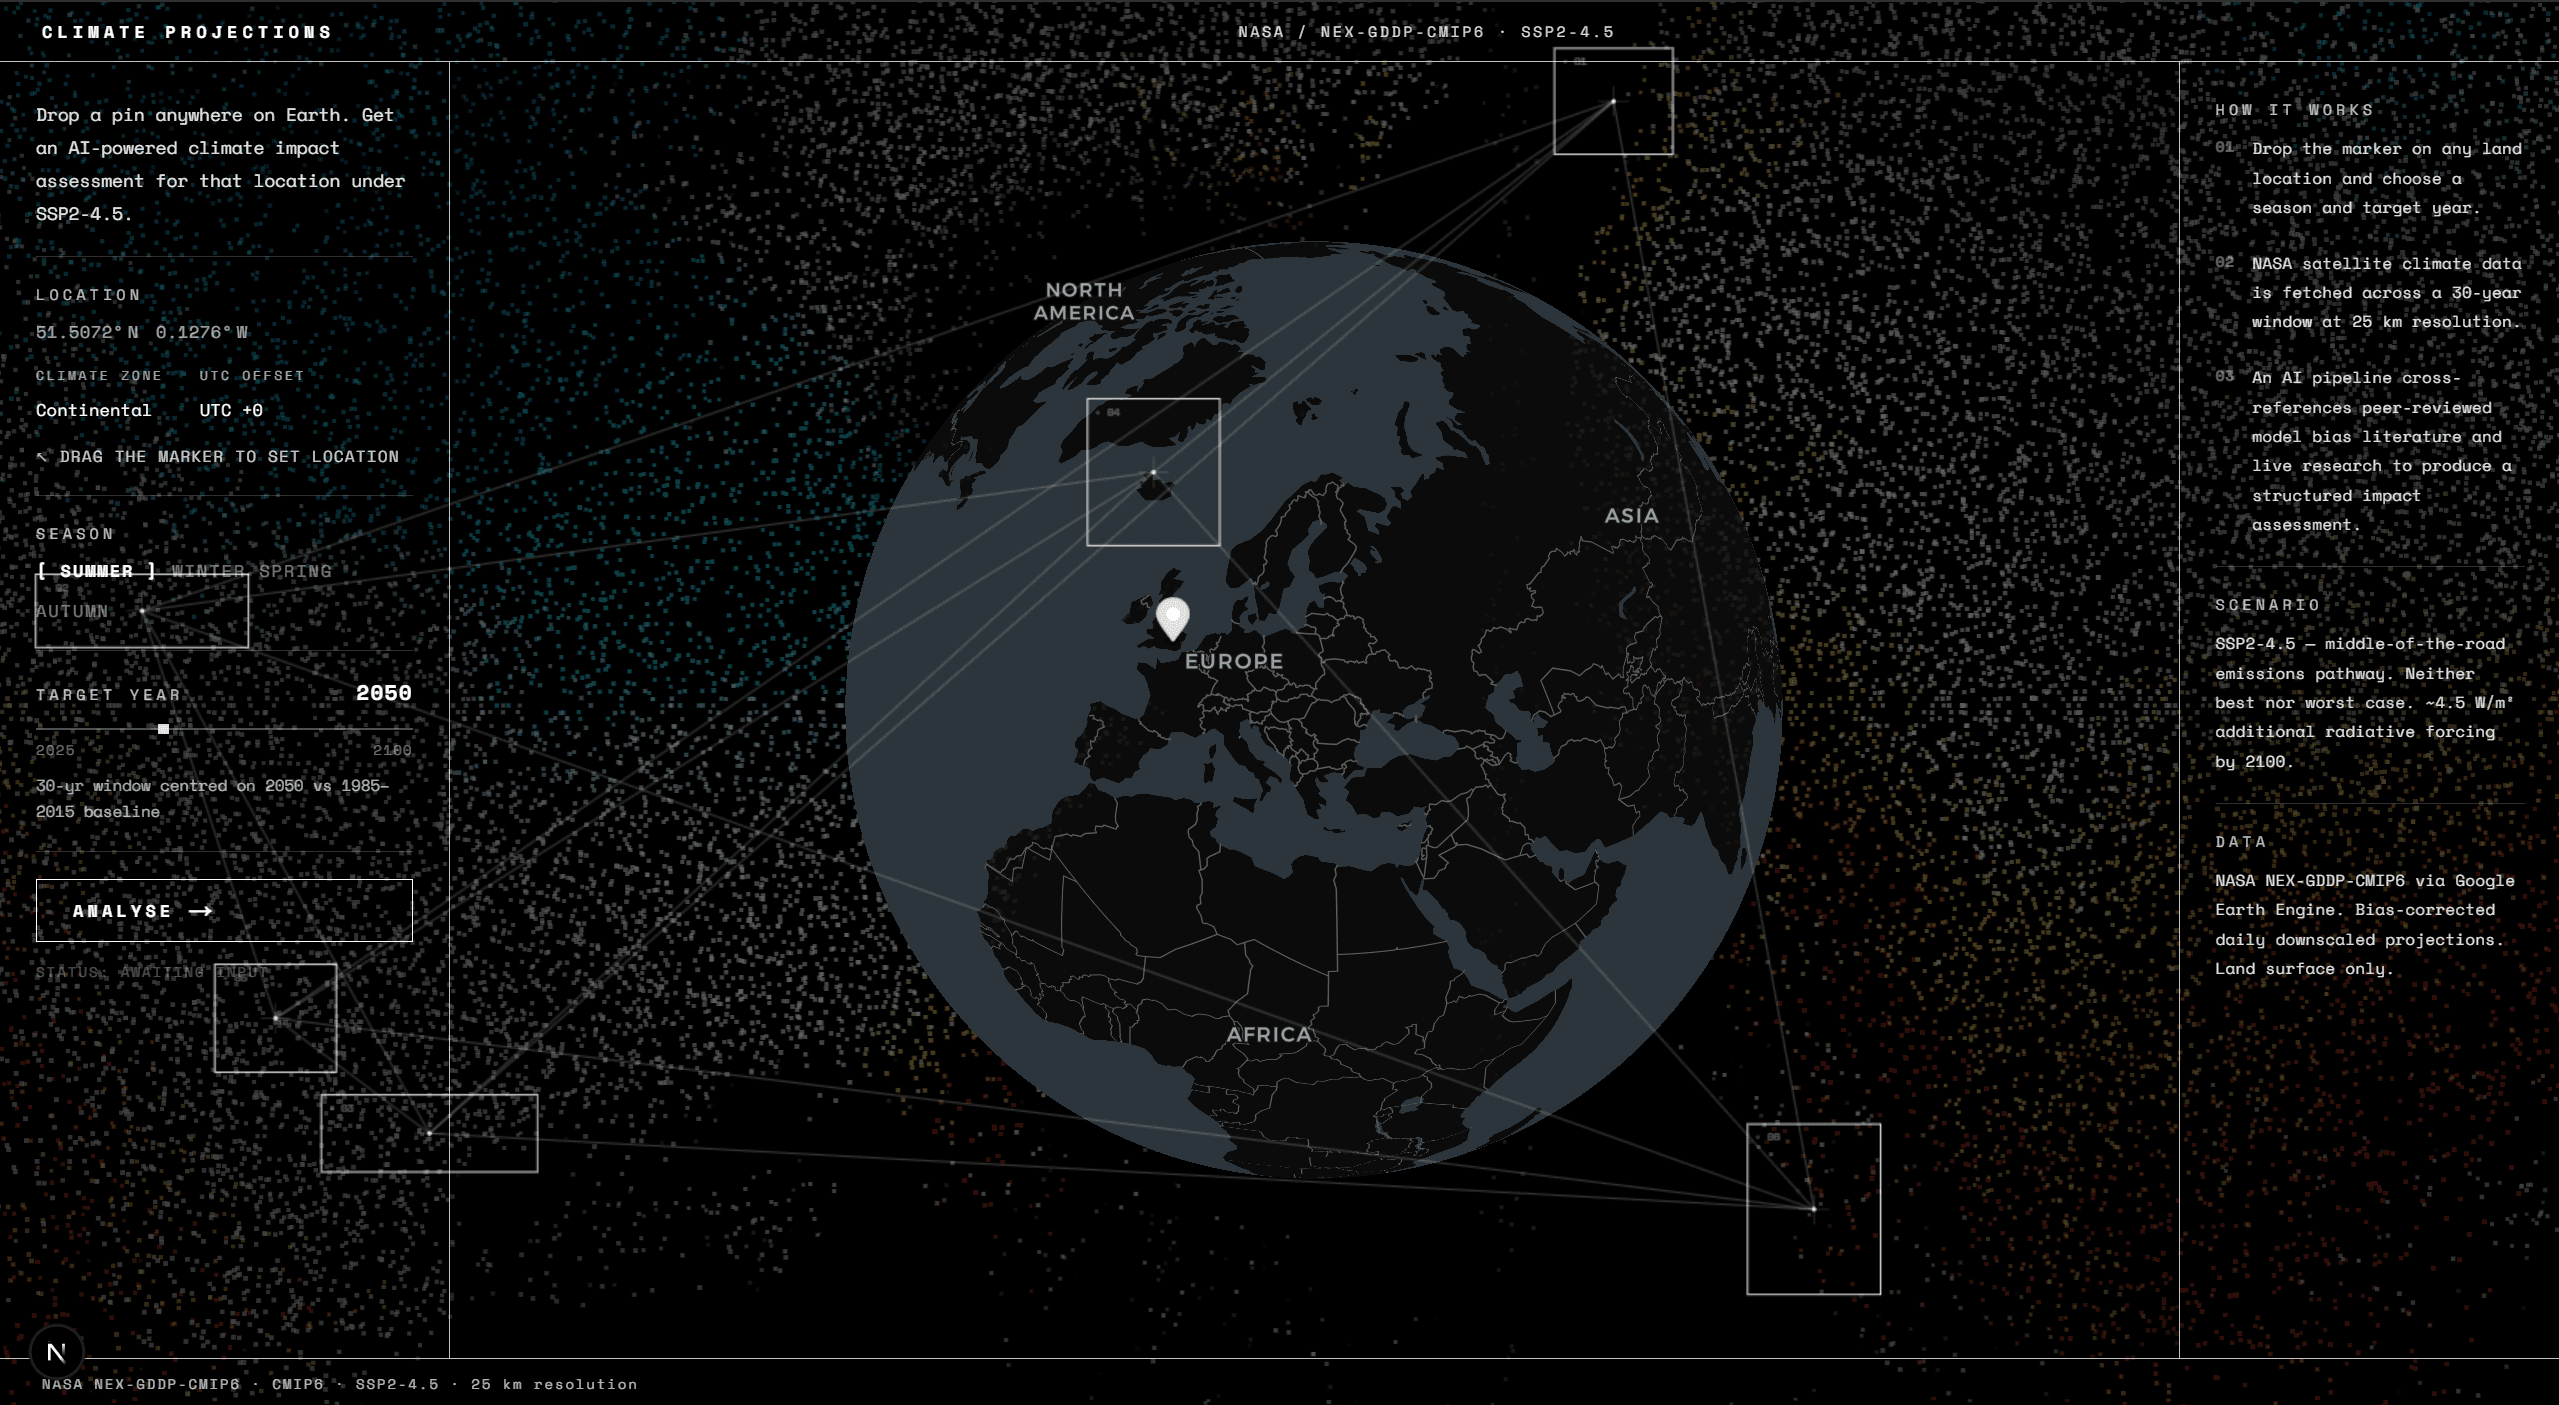
Climate Projection is a full-stack AI application that generates location-specific climate change forecasts for any point on Earth. A user drops a pin on a 3D interactive globe, picks a season and a target year up to 2100, and the system returns a quantified scientific analysis (projected changes in temperature, precipitation, humidity, and wind speed) using real NASA satellite data, peer-reviewed research papers, and live web searches.
The landing page is built around a 3D globe the user can spin and drop a marker on. Behind it sits a GPU-accelerated particle system that samples colours from a real NASA temperature map image, placing thousands of tiny particles that glow and bloom. A second animation layer draws minimalist geometric boxes that drift slowly around the screen with connecting lines between them, creating a data-tracking aesthetic inspired by the artist Ryoji Ikeda. Before any analysis runs, the coordinates are pre-validated: the system checks whether the pin landed on water (ocean coordinates are rejected), and reverse-geocodes the point to a human-readable location name. Both checks run in parallel. Once a valid land location is submitted, the backend runs a four-stage pipeline and streams each result back as it completes, so the user sees progress as the process can take up to a minute to compute..
Not all climate models are equally accurate in all regions. The system selects the most geographically appropriate CMIP6 climate model for the chosen location from the 25 available in NASA's dataset. CMIP6 is the international ensemble of climate models that underpins the IPCC's assessments. The backend queries the NASA NEX-GDDP-CMIP6 dataset via Google Earth Engine, a planetary-scale geospatial computing platform. It fetches two data windows: A projected window: a 30-year range centred on the target year, filtered to the chosen season and the SSP2-4.5 emissions scenario A 1985–2015 historical baseline for comparison. For each window, it computes the mean and standard deviation across all six climate variables: near-surface relative humidity, wind speed, mean temperature, minimum temperature, maximum temperature, and precipitation rate. These are extracted at a single point at 25 km resolution. The difference between projected and baseline gives the climate signal, and the standard deviation tells the system how confident to be in that signal relative to natural variability.
Two AI research tasks run simultaneously:
Retrieval-Augmented Generation: A vector database holds chunks from 70+ open-access CMIP6 model evaluation papers. Gemini first generates a precise semantic search query targeting the specific model and region, then retrieves the most relevant paper excerpts. These surface known model biases, for example, whether a particular CMIP6 model is known to over-predict rainfall in a specific region, so the final analysis can qualify its claims accordingly. Web Search: using Google Gemini Search grounding, retrieves live scientific literature and regional climate impact assessments relevant to the computed anomaly signals. The search is seeded with the actual delta values, so it stays grounded in the specific numbers rather than returning generic climate overviews. Once both research tasks are complete, GPT-4.1 summarises everything into a structured output. The model is instructed to quantify every claim using the actual delta values, distinguish statistically robust signals from uncertain ones (where natural variability is larger than the projected change), and incorporate model-specific bias caveats from the paper excerpts. The output includes a narrative analysis, key takeaways, sector-specific impact bullets, a data table of all climate variables, and cited sources.